El diseño de las redes móviles tiene que ser actualizado para satisfacer los requisitos esperados de las redes de próxima generación. Más recientemente, los servicios que dependen de 5G son intrínsecamente móviles y dinámicos y se espera que funcionen sin problemas a través de redes heterogéneas. Las aplicaciones en 5G y posteriores, requieren una persistencia y continuidad de la sesión apoyada en la red. Para proporcionar un servicio continuo a los usuarios móviles, incluso si cambian su punto de conexión a la red, se han desarrollado numerosos protocolos de movilidad IP que son capaces de distribuir las funciones del plano de control y el plano de datos entre dispositivos situados en diferentes emplazamientos del Core o de la Red de Acceso.
El reciente advenimiento de las tecnologías de virtualización hace posible la introducción de estas funciones virtuales de movilidad en el SFC de reenvío. En este nuevo entorno, los algoritmos para la colocación óptima de las Funciones de Red Virtual son requerido para un desempeño exitoso de la red.
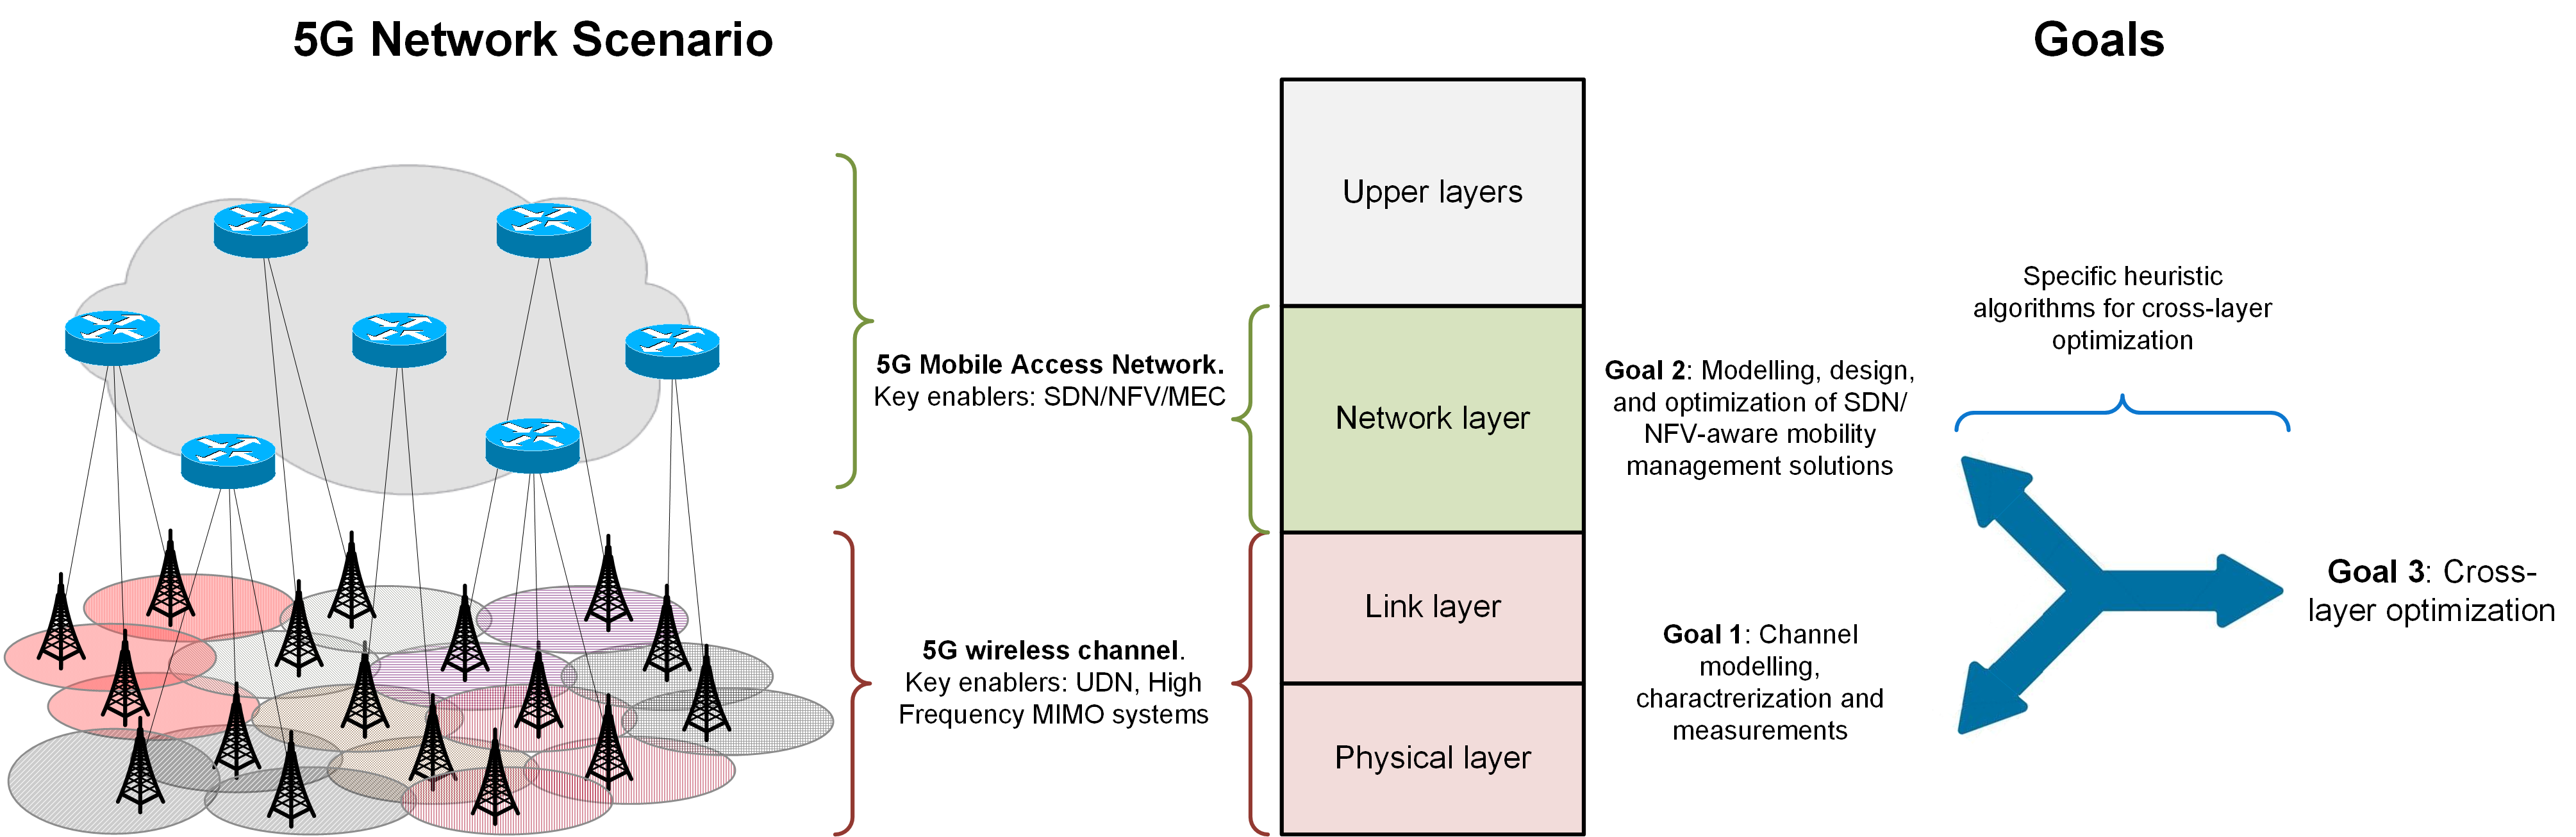
Se prevé que esta propuesta contribuya al desarrollo científico y tecnológico de los sistemas 5G, y se ajusta claramente a la experiencia de los miembros del proyecto en los ámbitos de las telecomunicaciones y la optimización. El proyecto tiene por objeto equilibrar los niveles de red y físicos, que están relativamente desconectados en la literatura, combinándolos adecuadamente para lograr avances relevantes en ambos.